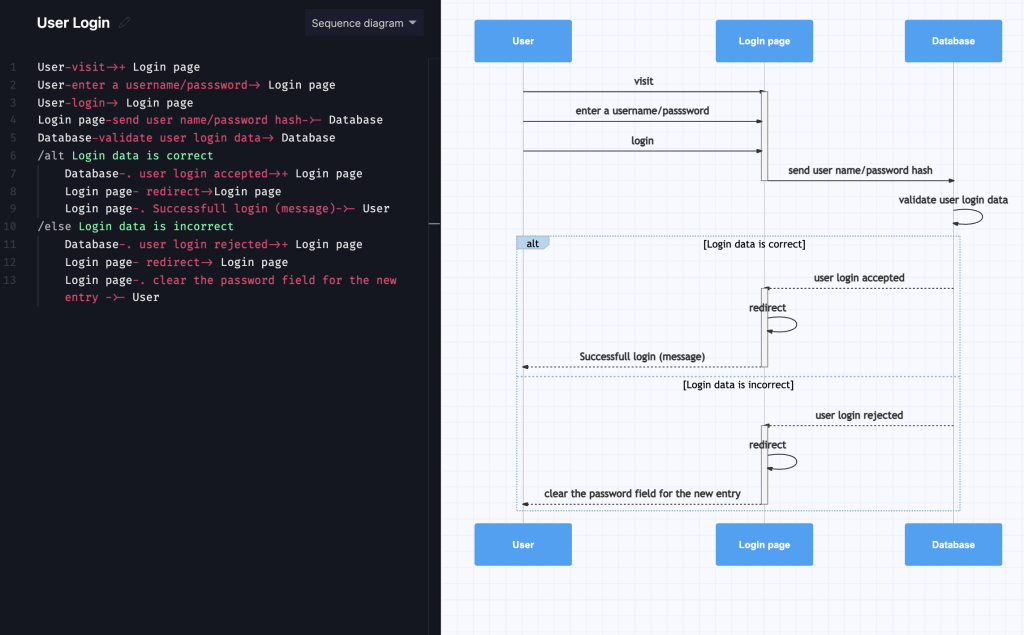
6 tools to turn code into beautiful diagrams
6 tools to turn code into beautiful diagrams
- Diagrams
- Mermaid
- Markmap
- ASCII editors
- PlantUML
- Go-Diagrams
Here’s a brief overview of each tool:
1. Diagrams:
- Description: A tool to create diagrams using Python code. It’s especially useful for visualizing cloud system architectures.
- Features:
- Supports AWS, Azure, GCP, Kubernetes, and more.
- Allows you to specify the architecture using Python, making it programmatically versatile.
- Usage: Great for developers who are familiar with Python and need to document cloud architectures.
2. Mermaid:
- Description: A JavaScript-based tool for creating diagrams and visualizations using text and code.
- Features:
- Supports various diagram types such as flowcharts, sequence diagrams, class diagrams, state diagrams, and more.
- Can be integrated into Markdown, making it suitable for documentation in GitHub, GitLab, and other Markdown-friendly environments.
- Usage: Ideal for embedding diagrams in documentation, wikis, and static site generators.
3. Markmap:
- Description: A tool to visualize Markdown documents as mind maps.
- Features:
- Transforms Markdown content into a dynamic, interactive mind map.
- Useful for brainstorming, note-taking, and organizing ideas visually.
- Usage: Perfect for users who work with Markdown and want to quickly create visual mind maps.
4. ASCII editors:
- Description: Tools for creating simple, text-based diagrams using ASCII characters.
- Features:
- Lightweight and requires no special software.
- Easily sharable in plain text format.
- Examples: Asciiflow, Monodraw.
- Usage: Useful for creating quick, simple diagrams in environments where graphical tools are not available or practical.
5. PlantUML:
- Description: A tool for creating UML diagrams from plain text descriptions.
- Features:
- Supports a wide range of UML diagrams including sequence, class, activity, and component diagrams.
- Integrates well with various IDEs and documentation tools.
- Usage: Great for developers and architects needing to document complex systems using UML.
6. Go-Diagrams:
- Description: A tool for creating diagrams using the Go programming language.
- Features:
- Provides libraries to construct and visualize diagrams programmatically.
- Suitable for network diagrams, flowcharts, and other structured diagrams.
- Usage: Best for developers proficient in Go who need to generate diagrams programmatically.
These tools offer a range of capabilities to turn code and text into visual representations, catering to different needs and preferences in documentation and diagramming.